Predicting Market Shifts with Technical Analysis
- Understanding Technical Analysis in Market Forecasting
- Key Indicators to Watch for in Technical Analysis
- Using Historical Data to Predict Market Trends
- Common Mistakes to Avoid in Technical Analysis
- Implementing Technical Analysis Strategies for Successful Trading
- The Role of Technical Analysis in Anticipating Market Shifts
Understanding Technical Analysis in Market Forecasting
Technical analysis is a method used by traders and investors to forecast future price movements based on historical market data. By analyzing charts and patterns, technical analysts aim to identify trends and patterns that can help predict market shifts. Understanding technical analysis is essential for making informed decisions in the financial markets.
One of the key principles of technical analysis is that historical price movements tend to repeat themselves. This is based on the idea that market participants often exhibit similar behavior in response to certain market conditions. By studying past price movements, analysts can identify patterns that may indicate potential future price movements.
Technical analysts use various tools and indicators to analyze market data. These tools can include moving averages, support and resistance levels, and chart patterns such as head and shoulders or double tops. By combining these tools with other forms of analysis, traders can gain a more comprehensive understanding of market trends.
It is important to note that technical analysis is not foolproof and should be used in conjunction with other forms of analysis, such as fundamental analysis. While technical analysis can provide valuable insights into market trends, it is not a guarantee of future performance. Traders and investors should use technical analysis as part of a broader strategy to make informed decisions in the financial markets.
Key Indicators to Watch for in Technical Analysis
When utilizing technical analysis to predict market shifts, there are several key indicators that traders should closely monitor. These indicators can provide valuable insights into market trends and potential price movements. By keeping a close eye on these key indicators, traders can make more informed decisions and improve their overall trading strategy.
- Moving Averages: Moving averages are a popular technical indicator that helps traders identify trends by smoothing out price fluctuations over a specific period of time.
- Relative Strength Index (RSI): The RSI is a momentum oscillator that measures the speed and change of price movements. It can help traders determine if a stock is overbought or oversold.
- Volume: Monitoring trading volume can provide insights into the strength of a price movement. High volume often confirms the validity of a trend, while low volume may indicate a reversal.
- Support and Resistance Levels: Identifying key support and resistance levels can help traders determine potential entry and exit points. These levels are areas where the price tends to bounce off or reverse.
- MACD (Moving Average Convergence Divergence): The MACD is a trend-following momentum indicator that shows the relationship between two moving averages of a security’s price. Traders use it to identify changes in the strength, direction, momentum, and duration of a trend.
By paying attention to these key indicators and understanding how they interact with each other, traders can gain a better understanding of market dynamics and improve their ability to predict market shifts. It is essential to use a combination of these indicators in conjunction with other tools and analysis techniques to make well-informed trading decisions.
Using Historical Data to Predict Market Trends
One effective method for predicting market shifts is by analyzing historical data to identify trends and patterns that may indicate future movements. By examining past market behavior, traders and investors can gain valuable insights into potential future price movements. This approach, known as technical analysis, involves studying charts and graphs to identify recurring patterns and trends that may help predict future market behavior.
Historical data can provide valuable information about how certain assets have performed in the past under similar market conditions. By analyzing historical price movements, traders can identify key support and resistance levels, as well as potential trend reversals. This information can help traders make more informed decisions about when to enter or exit trades, based on historical patterns that may indicate future price movements.
In addition to analyzing price movements, historical data can also provide insights into market sentiment and investor behavior. By studying past market trends, traders can gain a better understanding of how market participants have reacted to certain events or news in the past. This information can help traders anticipate how the market may react to similar events in the future, allowing them to make more informed trading decisions.
Overall, using historical data to predict market trends can be a valuable tool for traders and investors looking to gain an edge in the market. By analyzing past price movements and market behavior, traders can identify patterns and trends that may help them anticipate future market shifts. While historical data is not a foolproof method for predicting market movements, it can provide valuable insights that can help traders make more informed decisions when trading in the financial markets.
Common Mistakes to Avoid in Technical Analysis
When utilizing technical analysis to predict market shifts, it is crucial to be aware of common mistakes that can hinder your success. By avoiding these pitfalls, you can improve the accuracy of your predictions and make more informed trading decisions.
- One common mistake to avoid is relying too heavily on a single indicator. While indicators can provide valuable insights, using multiple indicators can offer a more comprehensive view of market trends.
- Another mistake is ignoring the broader market context. It is essential to consider factors such as economic data, geopolitical events, and market sentiment when analyzing price movements.
- Overlooking the importance of risk management is another critical error. Setting stop-loss orders and managing your risk effectively can help protect your capital and prevent significant losses.
- Additionally, falling into the trap of confirmation bias can lead to inaccurate predictions. It is essential to remain objective and consider all available information, even if it contradicts your initial hypothesis.
- Finally, failing to adapt to changing market conditions can be detrimental. Markets are constantly evolving, and it is crucial to adjust your analysis and strategies accordingly.
Implementing Technical Analysis Strategies for Successful Trading
Implementing technical analysis strategies is crucial for successful trading in the financial markets. By utilizing various tools and indicators, traders can make informed decisions based on historical price movements and market trends. Here are some key strategies to consider:
- Identify key support and resistance levels: By analyzing historical price data, traders can pinpoint levels where the price tends to reverse. These levels act as barriers that the price must break through to continue its trend.
- Utilize moving averages: Moving averages help smooth out price data to identify trends over a specific period. Traders often use the crossover of different moving averages as a signal to enter or exit trades.
- Use technical indicators: Indicators such as the Relative Strength Index (RSI) or Moving Average Convergence Divergence (MACD) can help traders identify overbought or oversold conditions in the market.
- Implement chart patterns: Patterns such as head and shoulders, triangles, and flags can provide valuable insights into potential market shifts. Traders can use these patterns to anticipate future price movements.
By incorporating these technical analysis strategies into your trading routine, you can increase your chances of making profitable trades. Remember to combine these strategies with fundamental analysis and risk management techniques for a well-rounded approach to trading the markets.
The Role of Technical Analysis in Anticipating Market Shifts
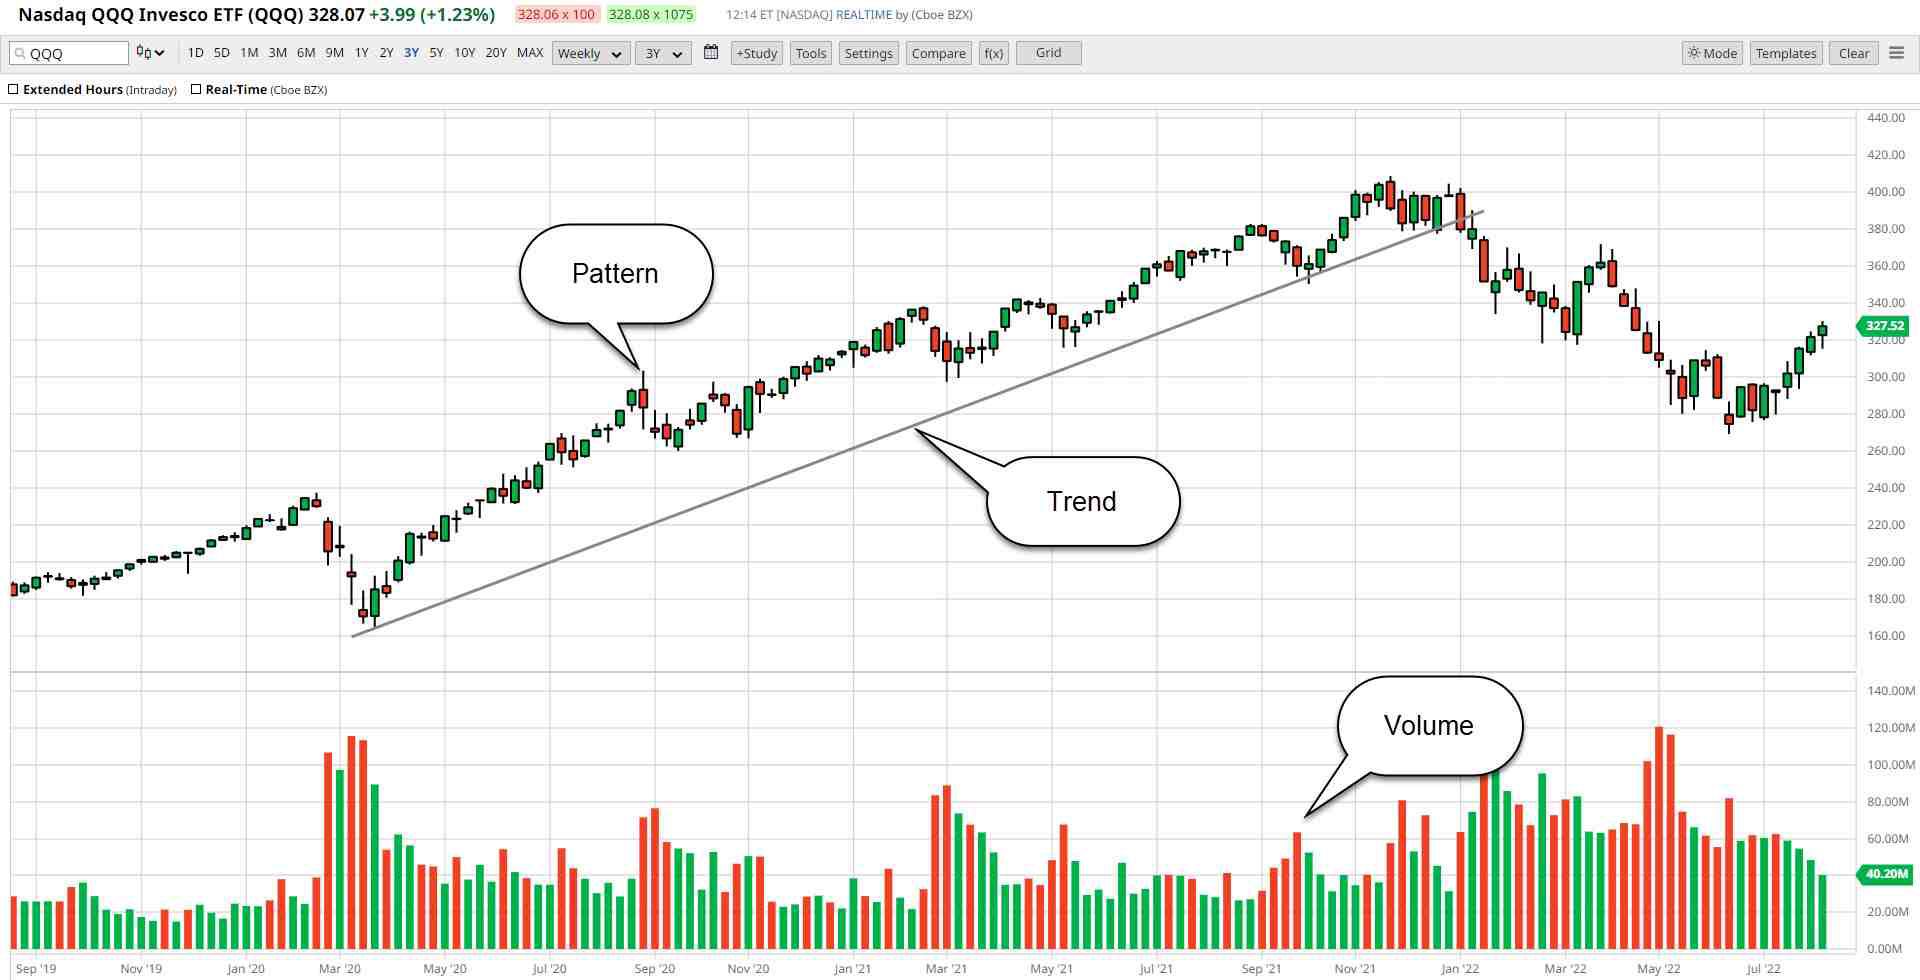
Technical analysis plays a crucial role in anticipating market shifts by analyzing historical price data and volume to identify patterns and trends. By examining charts and using various indicators, traders can gain insights into potential future price movements.
One of the key benefits of technical analysis is its ability to help traders make informed decisions based on market behavior rather than emotions. By focusing on objective data, traders can better understand market dynamics and anticipate shifts before they occur.
Technical analysis can also be used to identify support and resistance levels, which are key areas where prices are likely to reverse. By recognizing these levels, traders can set appropriate entry and exit points to maximize profits and minimize losses.
Overall, technical analysis provides traders with a valuable tool for predicting market shifts and making informed trading decisions. By leveraging historical data and patterns, traders can gain a competitive edge in the market and improve their overall trading performance.